Climate Analysis
The Maproom explores historical daily precipitation by calculating simple seasonal
statistics.
The Maproom explores historical daily temperature by calculating simple seasonal statistics.
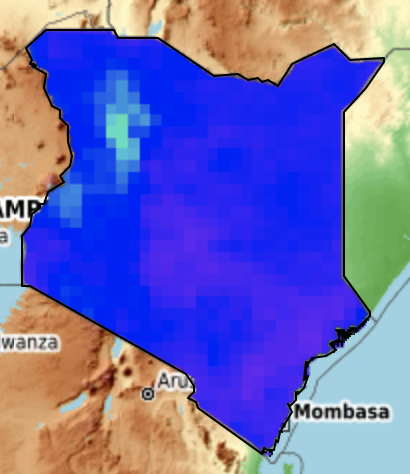
Rainfall and temperature time series reconstructed from station observations and remote
sensing proxies. This interface allows users to view rainfall, maximum, minimum and
mean temperature dekadal climatologies and anomalies.
Rainfall time series (1981-2022) and temperature time series (1981-2022) reconstructed
from station observations, remote sensing and other proxies. This interface allows
users to view rainfall, maximum, minimum and mean temperature monthly climatologies
and anomalies.
Rainfall time series (1981-2022) and temperature time series (1981-2022) reconstructed
from station observations, remote sensing and other proxies. This interface allows
users to view rainfall, maximum, minimum and mean temperature seasonal climatologies,
anomalies and probability of exceedance.
Rainfall time series (1981-2022) and temperature time series (1981-2022) reconstructed
from station observations, remote sensing and other proxies. This interface allows
users to view rainfall, maximum, minimum and mean temperature seasonal trends expressed
per year, over the selected period or percent of the average over the selected period.
The Standardized Precipitation Index is an indicator of extreme rainfall events, whether
they are drought or excess rainfall.
The Maproom facilitates the exploration of the history of extreme monthly and seasonal
rainfall characteristics.
The Maproom facilitates the exploration of the history of extreme monthly and seasonal
minimum and maximum temperatures.
This map shows the historical probability (given in percentile) of seasonal average
monthly rainfall falling within the upper (wet), middle (normal), or bottom (dry)
one-third ("tercile") of the 1981-2022 historical distribution in Kenya given the
state of ENSO (El Niño, Neutral, La Niña) during that same season.
This map shows the historical probability (given in percentile) of seasonal average
monthly minimum or maximum temperature falling within the upper (hot), middle (normal),
or bottom (cold) one-third ("tercile") of the 1981-2022 historical distribution in
Kenya given the state of ENSO (El Niño, Neutral, La Niña) during that same season.
This map shows the historical probability (given in percentile) of seasonal average
monthly rainfall falling within the upper (wet), middle (normal), or bottom (dry)
one-third ("tercile") of the 1991-2020 historical distribution in Kenya given the
Terciles of IOD (Postive, Neutral, Negative) during that same season.
This map shows the historical probability (given in percentile) of seasonal average
monthly temperature falling within the upper (hot), middle (normal), or bottom (cold)
one-third ("tercile") of the 1991-2020 historical distribution in Kenya given the
Terciles of IOD (Postive, Neutral, Negative) during that same season.
Climate Monitoring
This Analysis tool allows users to view different presentations of the the most recent
dekad.
The 1-month Weighted Anomaly Standardization Precipitation (WASP) index provides a
simple visual means of extreme rainfall events for the past month, whether they are
drought or excess rainfall.
The 3-month Weighted Anomaly Standardization Precipitation (WASP) index provides a
simple visual means of extreme rainfall events for the past season, whether they are
drought or excess rainfall.
The 12-month Weighted Anomaly Standardization Precipitation (WASP) index provides
a simple visual means of extreme rainfall events for the past 12 months, whether they
are drought or excess rainfall.
The Standardized Precipitation Index is an indicator of extreme rainfall events, whether
they are drought or excess rainfall.
The Standardized Precipitation Index is an indicator of extreme rainfall events, whether
they are drought or excess rainfall.
Climate Change
The Standardized Precipitation Index is an indicator of extreme rainfall events, whether
they are drought or excess rainfall.
The level of agreement on either positive or negative change in a future time period
with reference to the baseline (historical period).
Future changes in seasonal climate with reference to a historical climatological period.
Climatological period is user defined and is same in both historical and future periods.
Future projections are based on the representative concentration pathways (RCPs).
//var/parameter/(.precip)/eq/{.Rainfall}{.Temperature}ifelse/.dekadal/.c9120//var/get_parameter/interp/T/(1-10%20Sep)/VALUE//name//clim_var/def/SOURCES/.WORLDBATH/.bath/X/32/43/RANGE/Y/-6/6/RANGE/1/index/SOURCES/.Features/.Political/.Kenya/a:/.kenya_wards//name//Wards/def/.the_geom/:a:/.gadm36_ken_2//name//SubCounties/def/.the_geom/:a:/.Counties/.the_geom/:a/X/Y/fig-/colors/colors/||/colors/grey/verythin/stroke/stroke/black/thinnish/stroke/-fig//antialias/true/psdef//layers[//clim_var//SubCounties//Counties/]psdef//plotborder/0/psdef//antialias/true/psdef//plotaxislength/220/psdef/+.gif)
//var/parameter/(.precip)/eq/{.Rainfall}{.Temperature}ifelse/.monthly/.c9120//var/get_parameter/interp/T/(Oct)/VALUE//name//clim_var/def/SOURCES/.WORLDBATH/.bath/X/32/43/RANGE/Y/-6/6/RANGE/1/index/SOURCES/.Features/.Political/.Kenya/a:/.kenya_wards//name//Wards/def/.the_geom/:a:/.gadm36_ken_2//name//SubCounties/def/.the_geom/:a:/.Counties/.the_geom/:a/X/Y/fig-/colors/grey/verythin/stroke/stroke/black/thinnish/stroke/-fig//layers%5B//clim_var//SubCounties//Counties%5Dpsdef//antialias/true/psdef//plotborder/0/psdef//plotaxislength/220/psdef/+.gif)
//var/parameter/(.precip)/eq/{.Rainfall}{.Temperature}ifelse/.monthly//var/get_parameter/interp/T/(Jun)//seasonStart/parameter/(-)/append/(Aug)//seasonEnd/parameter/append/(%20)/append/(1981)//YearStart/parameter/append/(-)/append/(2022)//YearEnd/parameter/append/seasonalAverage//var/get_parameter/(.precip)/eq/%7B//seasonEnd/get_parameter/interp//seasonStart/get_parameter/interp/sub/dup/0/ge/%7B1/add%7D%7B13/add%7Difelse/mul/%7Dif/T/last/VALUE/SOURCES/.Features/.Political/.Kenya/a:/.kenya_wards//name//Wards/def/.the_geom/:a:/.gadm36_ken_2//name//SubCounties/def/.the_geom/:a:/.Counties/.the_geom/:a/X/Y/fig-/colors/grey/verythin/stroke/stroke/black/thinnish/stroke/-fig//plotborder/0/psdef//antialias/true/psdef//plotaxislength/220/psdef/+.gif)


//season/parameter/seasonalAverage/%5BT%5Dpercentileover/%7BDry/0.33333/Normal/0.66667/Wet%7Dclassify/SOURCES/.NOAA/.NCDC/.ERSST/.version5/.IOD/.C1991-2020/.iod/T/(Jan-Mar)//season/parameter/seasonalAverage/%5BT%5Dpercentileover/%7BNegative/0.33333/Neutral/0.66667/Positive%7Dclassify/T//season/get_parameter/VALUES/1/masklt/mul/%5BT%5Daverage/tercileclassesscale/precip//Tercile/renameGRID/DATA/0/1/RANGE/iod/(Positive)//iodTercile/parameter/VALUE/Tercile/(Wet)//tercile/parameter/VALUE//name//proba/def//long_name/(Probability)/def/SOURCES/.WORLDBATH/.bath/X/32/43/RANGE/Y/-6/6/RANGE/1/index/SOURCES/.Features/.Political/.Kenya/a:/.kenya_wards//name//Wards/def/.the_geom/:a:/.gadm36_ken_2//name//SubCounties/def/.the_geom/:a:/.Counties/.the_geom/:a/X/Y/fig-/colors/colors/%7C%7C/colors/grey/verythin/stroke/stroke/black/thinnish/stroke/-fig//antialias/true/psdef//plotaxislength/220/psdef//plotborder/0/psdef//color_smoothing/1/psdef//layers%5B//proba//SubCounties//Counties%5Dpsdef/+.gif)
//var/parameter/interp/T/(Jan-Mar)//season/parameter/seasonalAverage/%5BT%5Dpercentileover/%7BCold/0.33333/Normal/0.66667/Hot%7Dclassify/SOURCES/.NOAA/.NCDC/.ERSST/.version5/.IOD/.C1991-2020/.iod/T/(Jan-Mar)//season/parameter/seasonalAverage/%5BT%5Dpercentileover/%7BNegative/0.33333/Neutral/0.66667/Positive%7Dclassify/T//season/get_parameter/VALUES/1/masklt/mul/%5BT%5Daverage/tercileclassesscale//var/get_parameter/1/4/getinterval/interp//Tercile/renameGRID/DATA/0/1/RANGE/iod/(Positive)//iodTercile/parameter/VALUE/Tercile/(Hot)//tercile/parameter/VALUE//name//proba/def//long_name/(Probability)/def/SOURCES/.WORLDBATH/.bath/X/32/43/RANGE/Y/-6/6/RANGE/1/index/SOURCES/.Features/.Political/.Kenya/a:/.kenya_wards//name//Wards/def/.the_geom/:a:/.gadm36_ken_2//name//SubCounties/def/.the_geom/:a:/.Counties/.the_geom/:a/X/Y/fig-/colors/colors/%7C%7C/colors/grey/verythin/stroke/stroke/black/thinnish/stroke/-fig//antialias/true/psdef//plotaxislength/220/psdef//plotborder/0/psdef//color_smoothing/1/psdef//layers%5B//proba//SubCounties//Counties%5Dpsdef/+.gif)
//monitAna/parameter/(rainfall)/eq/{.precip}if//name/(monitAna)/def/SOURCES/.WORLDBATH/.bath/X/32/43/RANGE/Y/-6/6/RANGE/1/index/SOURCES/.Features/.Political/.Kenya/a:/.kenya_wards//name//Wards/def/.the_geom/:a:/.gadm36_ken_2//name//SubCounties/def/.the_geom/:a:/.Counties/.the_geom/:a/X/Y/fig-/colors/colors/||/colors/grey/verythin/stroke/stroke/black/thinnish/stroke/-fig//antialias/true/psdef//T/last/plotvalue//layers%5B//monitAna//SubCounties//Counties%5Dpsdef+//plotaxislength+220+psdef//plotborder+0+psdef//color_smoothing+1+psdef+.gif)